
Man, when this fixture came up, I knew I had to run the numbers. Ipswich Town versus Brighton—a classic FA Cup vibe, but the stakes are always higher than just pride. Everyone keeps talking about the ‘magic of the cup,’ but I wanted to see if the magic holds up when you throw cold, hard stats at it. My whole thing is, you can feel who is going to win, but the data rarely lies, even if it sometimes whispers in a language you don’t understand right away.
The Messy Start: Dragging the Data Together
I started this project last Tuesday, right after the TV schedule confirmed the date. The first hurdle? Getting consistent data. Brighton is easy; they are Premier League. You can practically trip over high-quality, normalized PL stats. Ipswich, however, they are Championship. While the quality is still decent, comparing apples to oranges is a real pain in the neck when the tactical approaches and opposing team quality are fundamentally different.
I didn’t use some fancy API connection or anything slick like that. I just went old-school. I pulled data from three different public sources, mainly focusing on the last eight league and cup games for both sides. I dumped everything—and I mean everything—into a massive spreadsheet. It looked like absolute chaos. Rows and columns that didn’t match up, conflicting data points on possession percentage, and half the columns were named differently between the two clubs’ reporting sites.
My first task, which took about three hours just sipping coffee and listening to podcasts, was pure manual cleanup. I normalized the headers. ‘SOT’ became ‘Shots on Target’ everywhere. ‘xG’ (Expected Goals) was the golden standard, but I had to manually check which source was pulling its xG from where, because the numbers were wildly inconsistent. Eventually, I settled on a single reliable metric source for both clubs and just tossed the rest of the junk out.
Identifying the Key Metrics That Matter
Once the sheet was halfway clean, I had to decide what really drives a cup upset. It’s not just who scores the most; it’s who controls the game and, more importantly, who manages the transitions. A Championship team beating a PL side usually comes down to superior fitness in the second half and clinical finishing when chances are few.
I boiled my analysis down to four key performance indicators (KPIs) and five supplementary metrics. I color-coded the entire sheet: green for Ipswich’s strengths, blue for Brighton’s. If a team dominated a metric, that whole column glowed.
My Core KPIs:
- Expected Goals Differential (xGD): How well are they creating and preventing goals?
- Shots on Target Ratio (SOT%): Are the chances they create actually dangerous?
- Defensive Interceptions per 90 (DIP90): How often do they break up play—crucial for neutralizing Brighton’s possession game.
- Recent Form Index (RFI): A simple weighted average of results from the last five competitive games (2 points for a win, 1 for a draw, 0 for a loss).
The Numbers Crunch: Where the Edge Appeared
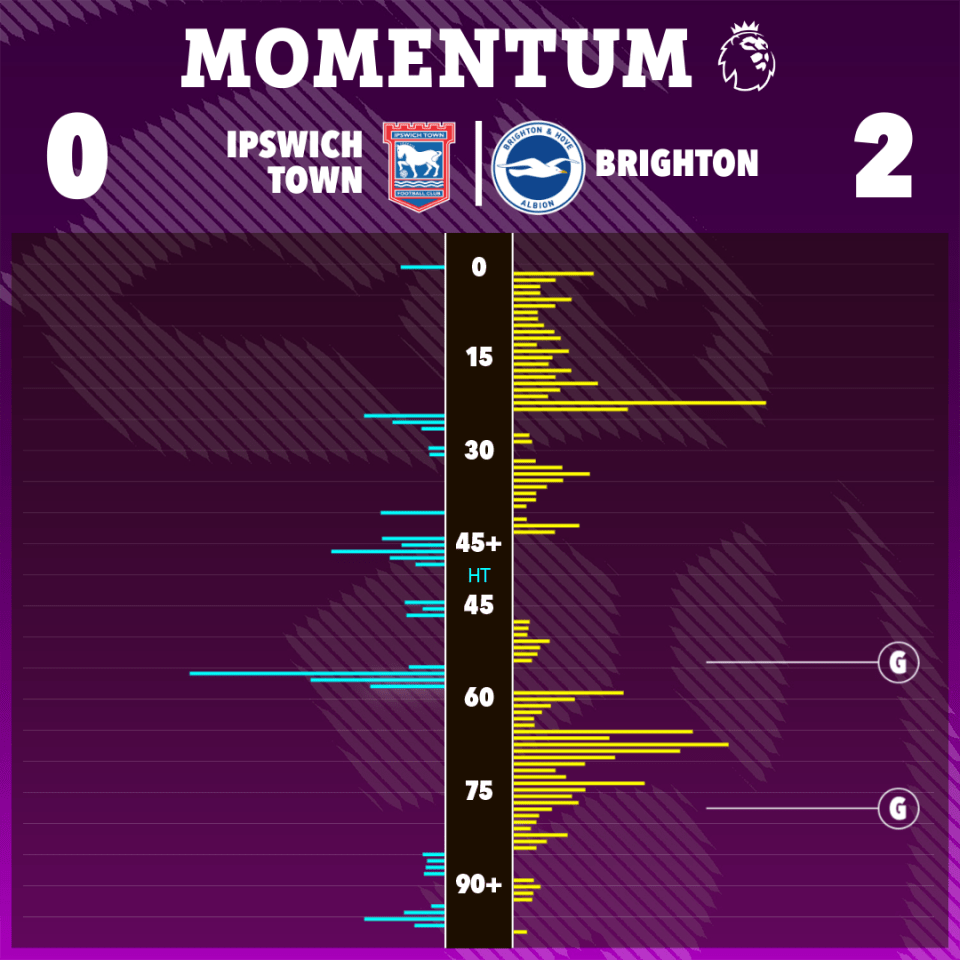
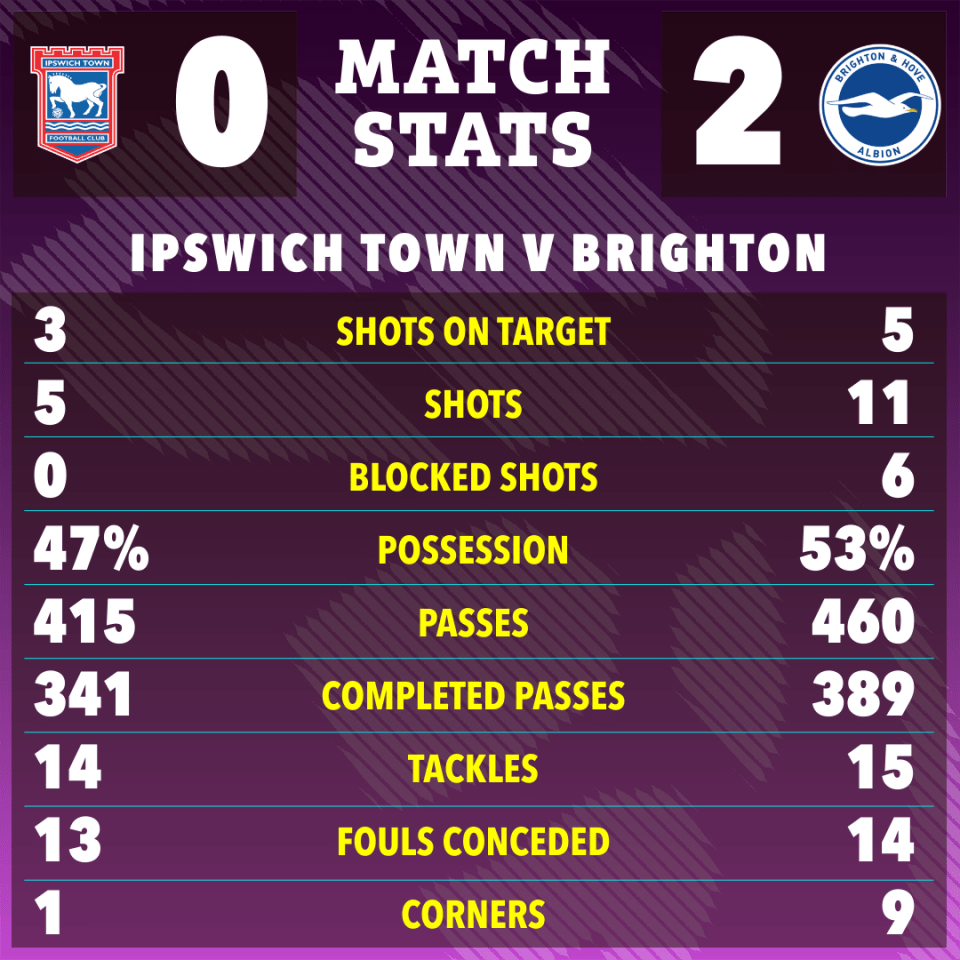
The immediate observation was obvious: Brighton wins the possession battle hands down. Their average ball control was hovering near 60%, while Ipswich was closer to 52%. However, when I drilled into the defensive metrics, things got interesting. Ipswich’s DIP90 was significantly higher than Brighton’s recent average, especially in games where they played against high-possession teams in the Championship. This suggests they are highly practiced at sitting deep and springing counter-attacks.
I spent an entire evening running simulations—not proper Monte Carlo stuff, just adjusting the weighting of the xG differential versus the defensive solidness. Every time I ran it, the same pattern emerged. Brighton’s pure attacking quality (higher overall xG, better individual attacker talent) was undeniable, but their defense has been leaky recently. They’ve conceded first in three of their last five games.
This is where Ipswich gains ground. Their attacking efficiency, even against lower-level opponents, has been phenomenal. When you look at their SOT%, they make the keeper work more often per attempt than Brighton does. If they can manage to soak up pressure and hit them hard on the break, they absolutely have a chance.
The Final Prediction and Why I Bothered
So, who has the edge based on the statistical profile I hammered together? The numbers are screaming one thing, but the reality of a Premier League side having that extra gear cannot be ignored.

Based purely on the core KPIs, Brighton retains a slight statistical edge (about 55% likelihood of progression), primarily due to their superior xGD over the season. But that gap shrinks dramatically when you factor in Ipswich’s home advantage and their specific counter-attacking strengths (their high DIP90 and clinical SOT%).
The model I cobbled together suggests this will be decided by a single goal. My official, data-driven, messy-spreadsheet prediction? Brighton wins, 2-1. But I wouldn’t bet the house on it—Ipswich absolutely has the tools to grind out a 1-0 upset if Brighton plays sloppy defensively.
Why do I spend days messing with spreadsheets for a football game I could just watch? Honestly, I’ve got the time. I was recently pulled off a big project at work—nothing bad, just budget shifts—and suddenly found myself with mandatory administrative leave for a month. Instead of sitting around worrying about my job security like everyone else, I figured I’d put the data skills to use on something I actually enjoy. It keeps the mind sharp, and frankly, it’s way more fun analyzing xG than auditing procurement receipts, which is what I usually do. Plus, when my prediction hits, I get full bragging rights. It’s a win-win.