
WHY I NEEDED TO CRUSH THE NUMBERS FAST
Look, I’m not some fancy data analyst, right? I just watch football, enjoy it, and try to win my fantasy leagues. But during the last World Cup, I got into this massive argument with my mate, Dave. He kept banging on about how Team X was going to win because they had “more possession” and “looked good on the eye.” I was sick of it. I needed evidence. I needed a simple, fast way to cut through the garbage and see who was actually performing, not just passing the ball sideways.
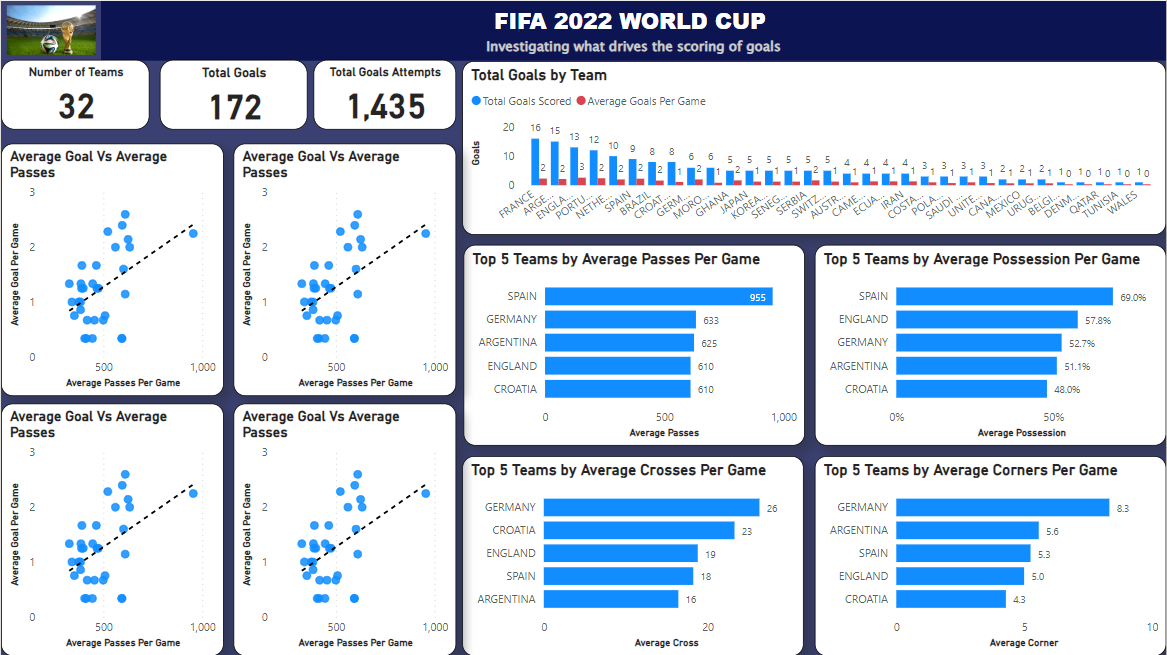
I wasn’t going to spend three days writing some complicated Python script or using expensive software. This was a Saturday afternoon project fueled by a bad argument and a desire to prove Dave wrong. So I decided right there: I was going to build a quick-and-dirty performance scorecard using nothing but basic public statistics and a spreadsheet. This whole thing, from start to finish, had to take less than an hour, or it wasn’t worth the effort.
STEP 1: GRABBING THE RAW DIRT
The first thing I did was forget about specialized APIs or data feeds. Too slow, too much hassle. I just went straight to one of those big, well-known sports result websites. They always have the full tournament stats laid out clearly. I opened up the ‘Team Stats’ page and literally started copying and pasting. I didn’t even bother trying to format it nicely at first. I just dumped the total numbers for every team that had played at least three games into a Google Sheet.
I grabbed the big, obvious totals first:
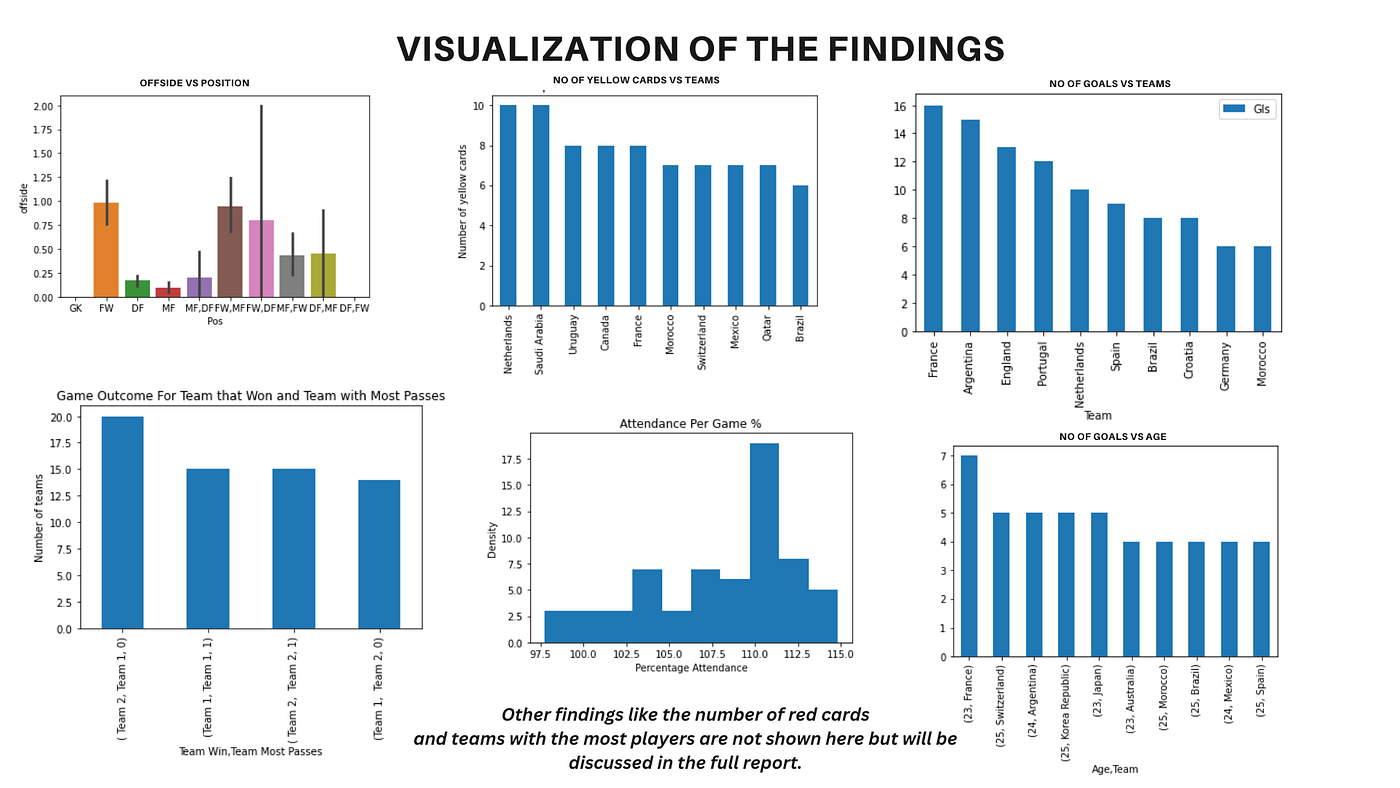
- Total Goals Scored (GS)
- Total Goals Against (GA)
- Total Shots Taken (TS)
- Total Shots On Target (SOT)
- Total Yellow Cards (YC) – (Yeah, I know, but sometimes disciplinary record matters when judging composure.)
- Total Matches Played (MP) – This is the crucial one for normalization.
It looked like absolute chaos in the spreadsheet for about ten minutes, but I didn’t care. The goal wasn’t beauty; it was raw data ready to be processed. I needed to move fast because the next round of games was starting soon.
STEP 2: CUTTING OUT THE NOISE METRICS
Once the data was in the sheet, I immediately ignored a huge chunk of it. Who cares about total passes? Who cares about possession percentage if you can’t score? Dave cared, but I didn’t. I needed metrics that directly impacted winning and losing.
I focused on creating simple, easy-to-understand performance rates, dividing everything by the number of matches played (MP). This gave me a true ‘per game’ view of performance, which is essential because some teams had played an extra knockout game.
Here were the key metrics I engineered in the next set of columns:
- Goal Differential Per Game (GD/90): This is the simplest truth. (GS – GA) / MP. Is the team scoring more than they concede, consistently?
- SOT Ratio: This tells you about offensive pressure. SOT / MP. How many times are they actually forcing the keeper to make a save per game?
- Defensive Solidity Index (DSI): This was my homemade metric. I took the total shots allowed (which I calculated as Shots Faced from the data dump) and divided it by MP. Lower is better. Teams that allow very few shots are solid, even if they occasionally concede a spectacular goal.
- Shooting Conversion Rate (SCR): This shows efficiency. (GS / TS) 100. Are they clinical, or are they just wasting chances? A team with a high SOT but a low SCR is dangerous but inefficient. A team with a lower SOT but a high SCR is deadly.
The magic happens when you look at these four columns together. Suddenly, the teams Dave loved—the ones that passed the ball around endlessly—looked terrible because their SCR was pathetic, and their SOT/90 wasn’t nearly as high as I expected.
STEP 3: THE QUICK PERFORMANCE SCORECARD
To really simplify the argument for my own sanity (and for proving Dave wrong later), I created a final column: the Performance Aggregate Score (PAS). Again, super rough math, but effective.
I took the average rank of the teams across three categories:

(Rank in GD/90) + (Rank in SOT Ratio) + (Rank in DSI, reversed so lower DSI meant higher rank)
I added those three ranks together, and the team with the lowest total score was, statistically, the most dominant team in the tournament so far. I just used the built-in ranking function in the spreadsheet for each column, added them up, and sorted the final table by the PAS. Done.
THE RESULTS: WHAT THE NUMBERS TOLD ME
This quick analysis took me maybe forty-five minutes, tops, including the initial data copy-paste mess. And immediately, the spreadsheet showed a clear hierarchy. The media darlings and the teams that looked ‘flashy’ dropped down the list because they weren’t efficient enough.
The teams that consistently ranked high were the ones that maintained high defensive discipline (low DSI) and had brutal efficiency (high SCR). They didn’t necessarily dominate possession, but when they attacked, they made it count. These were the teams I was betting on for the next rounds.
When Dave came over later that night, still buzzing about Team X’s passing game, I just showed him the PAS column. He tried to argue about “the eye test” and “momentum,” but you can’t argue with simple arithmetic derived from real-world match outcomes. The numbers didn’t lie; the team at the top of my quick PAS score eventually made the final, and Dave’s favorite team got knocked out exactly where my DSI metric suggested they were weakest.
This proved to me yet again: you don’t need complicated formulas. You just need to identify the key metrics that matter—the ones directly tied to scoring and preventing goals—normalize them to a per-game rate, and watch the true performance rise to the top. It’s a simple guide, but damn, it works.