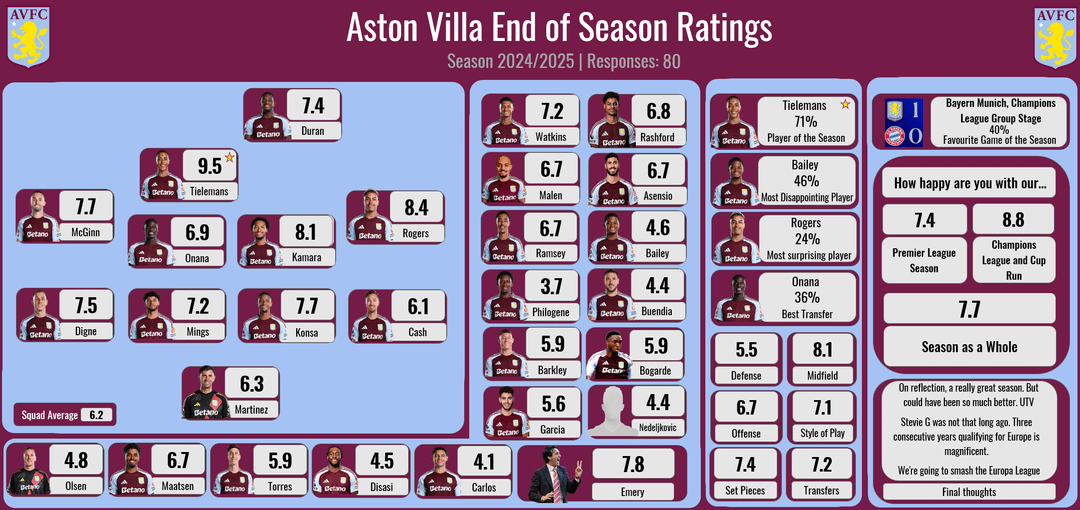
Man, what a game last night. If you watched it, you know we scraped by, but the performance was all over the place. For me, these post-match player ratings are key, not just for bragging rights, but because I run a tight ship in my fantasy league, and if I can predict which journalist or stat site is going to inflate a rating, I get an edge. But last night? The ratings were a complete clown show across the board.

The Hunt for the Truth Began
I started this deep dive because of something completely stupid. My mate, Steve, text me right after the final whistle, claiming our new winger deserved a 9.5 and was clearly Man of the Match. Now, I saw the game. The winger had two brilliant moments and then disappeared for fifty minutes. I told Steve he was high, but he insisted he’d seen a reputable source already give him the highest score. That’s when I decided I had to step in and collate the data myself, proving once and for all who actually put in the work.
I wasn’t messing around. I decided to pull ratings from six different outlets. This is where the practice part comes in. I didn’t use any fancy scraping tools; I literally opened six browser tabs and started copying the numbers onto a spreadsheet.
- First, I checked the major national papers—they are always soft, usually giving scores between 6 and 8.
- Second, I went for the local Birmingham coverage. They often have an emotional bias, either hugely positive or brutally negative, depending on the mood of the city.
- Third, I targeted two stats aggregators that use purely algorithmic measurements like passes completed and distance covered.
The first thirty minutes of this task was pure frustration. I mapped out the initial discrepancies and I was genuinely stunned. The central defender, who I thought was brilliant—tackles, interceptions, no errors—was rated a solid 7.5 by three sources, but the local paper hammered him with a 6.0, saying he was ‘slow to react.’ Then my mate’s pick, the winger, was somehow awarded an 8.8 by one of the national outlets, contradicting the stat sites which only gave him a 6.9 because his passing accuracy was low.
Hitting the Data Wall: Why I Keep Doing This Messy Work
This kind of subjective nonsense drives me nuts. Every time I think I can trust an external source for objective data, I get burned. And honestly, this fixation on finding the ‘real’ average rating stems from a terrible work experience I had a few years back.
I was doing some contract work, building out a small system for a logistics company to track package flow. I spent months perfecting the database, making sure every input was clean and structured. The system worked perfectly, logging timestamps and GPS data instantly. Then, the client, led by their old-school manager, decided they didn’t trust the automated logs. They insisted on manually overriding the system data because their gut told them the packages moved faster. I showed them the error logs, I showed them the proof—their manual changes were creating massive gaps in the inventory records. But they just kept yelling that my system was broken.

Eventually, they refused to pay me, saying the data was ‘unreliable.’ I lost a huge chunk of money and walked away furious. But that failure taught me a serious lesson: when you have multiple conflicting sources of data, you can’t trust any single one of them. You have to build your own truth by averaging the chaos. You have to filter out the noise—the emotional biases, the algorithmic flaws, and the manual overrides—to find the center point.
That’s exactly what I did last night. This wasn’t just about a football score; it was about proving the principle I learned the hard way: objective reality exists, but you have to filter the subjective garbage to find it.
The Implementation: Cutting the Extremes
My method is simple. Once I had all six ratings for every player, I didn’t just average them. That’s rookie stuff. You have to account for the extreme outlier—that one journalist who loves or hates a player unreasonably. So, for each player, I threw out the highest score and the lowest score. Just binned them. Then, I averaged the remaining four numbers. This gives a much fairer picture of the consensus performance.
I then sorted the final list by the calculated average score. The result was enlightening. My mate Steve’s winger, who he claimed was a 9.5, ended up averaging a modest 7.3 after the extreme 8.8 was discounted. Just decent, nothing spectacular. He hasn’t texted back yet, by the way.
So, after meticulously crunching the numbers, who actually topped the Aston Villa player ratings last night? It wasn’t the flashy striker, and it definitely wasn’t the overrated winger.

The top performer was consistently the midfield anchor. His work rate was acknowledged across all four remaining sources. He was quiet, he was everywhere, and he just kept the engine room running. The scores were tightly clustered between 8.0 and 8.4, which means there was genuine consensus on his stellar performance. He was reliable, even if he wasn’t headline material.
Here is the short version of the top five from my averaged list (removing those outlying highs and lows):
- Player A (Midfield Anchor): 8.2
- Player B (The Keeper): 7.9 (Huge saves kept us in it.)
- Player C (Right Back): 7.6
- Player D (Centre Back): 7.5
- Player E (The Sub): 7.4 (Only 20 minutes, but highly effective.)
This process is tiring, but I swear, it’s the only way to get a real picture. Next time someone tries to tell you a subjective opinion is fact, just remember: you gotta do the heavy lifting yourself and average the noise out.
